Why implement a data visualization toolkit in Rust?
I am happy to share Pluot, a new library for creating data visualizations.
Of course, developing a new plotting library is always a bit like the classic XKCD meme:

Have we created something useful, or just an additional competing thing? Here, I describe my motivations for this work, and leave it to you to decide.
Motivations
I create interactive data visualization tools for scientific researchers. Web-based tools have become the state-of-the-art, as they democratize access: the user does not need to fiddle with installing a native app and does not need to download the (increasingly large) datasets in order to view the visualizations. Not only are there user experience benefits to web-based visualization tools, but also developer experience ones: the web development ecosystem has come a long way, and there are many open-source web visualization toolkits that help developers to avoid reinventing the wheel.
The problem
Unfortunately, the web-based nature of these tools introduces two (related) issues: reproducibility and creation of publication-ready figures.
I was fortunate to be taught early in my career the power of pipelines and declarative workflow management tools for data analysis.
Others reading our papers should be able to reproduce our data analysis results by running a single terminal command (e.g., snakemake).
In the optimal case, this pipeline should start from nothing and finish with figure outputs identical to those that appear in the published paper.
It is then frustrating to think about the current disconnect between the development of web-based interactive tools and the creation of publication-ready figures. We seem to have convinced ourselves that it is perfectly acceptable for these processes to be separate. In other words, we tell ourselves that it is fine to use interactive tools for data exploration, as we only use these for hypothesis generation. Upon finding something interesting via an interactive tool, we will perform data analysis to confirm our finding is significant, during which we will write scripts to generate static plots for our publication figures. Thinking about these as separate processes makes it easier to justify the usage of different software toolkits during them. We tell ourselves that using a WebGL-based interactive tool in the former phase and creating a ggplot in the latter phase is perfectly fine!
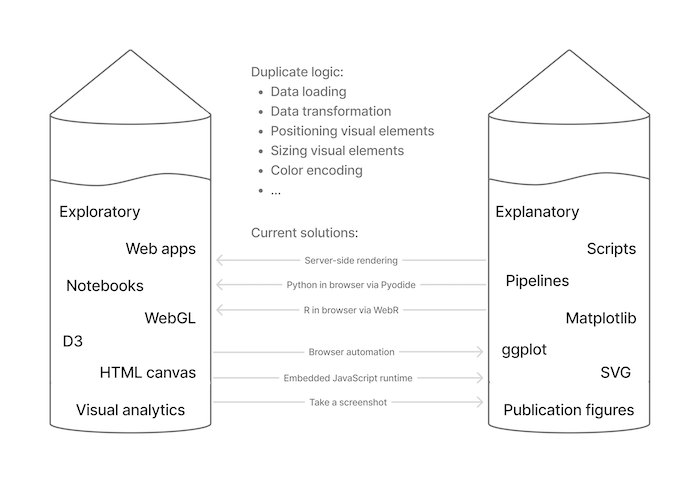
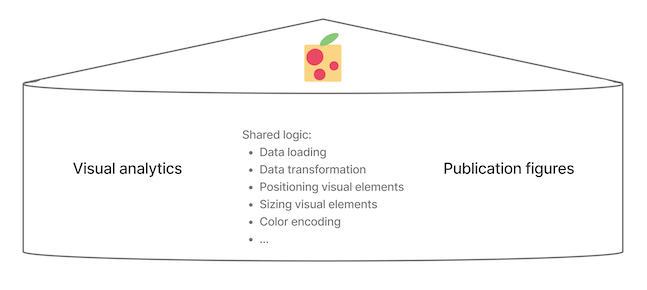
And it is fine in many cases. But personally, it gnaws at me to pour time and effort into developing specialized software to power web-based interactive tools, while knowing that entirely separate software toolkits will be used to create any downstream static publication figures. Both software toolkits often use the same fundamental logic, techniques, and algorithms -- without reusing any of the code! Shouldn't we aim to reduce these duplicate software development efforts (improving reproducibility in the process)?
The proof of concept
There are several challenges that have made this problem difficult to solve. For performance reasons, interactive tools often use bitmap-based rendering, via the HTML Canvas or WebGL APIs. Meanwhile, we often favor quality when static plotting, using SVG or PDF vector-based rendering. Finally, web software solutions are limited to using web technologies (JS/TS/HTML/CSS/WebGL), while static plotting often occurs in the data science environments of Python or R.
However, with the introduction of WebAssembly and WebGPU, the timing is perfect to close this gap. WebAssembly allows us to efficiently run software developed using systems programming languages in the web browser, and the new WebGPU API offers an ergonomic way to do GPU-accelerated rendering in the web browser. Specifically, the Rust programming language ecosystem offers tools to easily compile Rust code to WebAssembly (wasm-pack, wasm-bindgen, etc) and WGPU is a Rust-based implementation of WebGPU that can be run both inside and outside the browser (in fact, WGPU is how the WebGPU API is implemented under-the-hood in Firefox). By the end of 2025, WebGPU was supported in all three major web browsers.
Side note: "Great," you say! We can just take our existing native apps for visualization and compile them to run in the browser with WebAssembly! While possible, this is much easier said than done. These native applications are often large and complex, built over a long time assuming that all of the usual native app capabilities are available: filesystem, concurrency, etc. When building for the web there are additional constraints to consider, such as the application bundle size and user network speed.
For better or worse, rather than trying to squeeze a legacy native application code into these constraints it was not designed to satisfy, it can be quicker (and with fewer headaches) to build a solution from scratch, with the constraints considered from the beginning.
An alternative approach is to do the opposite: reuse existing web-based visualization code in native contexts. If you want to avoid depending on a full web browser, the best way to do this is via a standalone JavaScript runtime, as done by vl-convert. The advantage of this approach is that you can reuse most JavaScript code (caveat: the JS code must not be too tightly coupled to the browser), making it great from a reproducibility standpoint. The disadvantage is that there is still some overhead to using the JavaScript runtime (disclaimer: it would require benchmarking to confirm the exact performance tradeoffs). For many users and use-cases, this may be plenty good enough.
So, we can now implement our visualizations in Rust using WGPU, but what about usage from data science environments? Luckily, it is straightforward to create bindings to Rust programs from other languages such as Python.
The next key insight (or maybe just lie I told myself) is that it only takes a few key elements to go a long way to creating a visualization. Just being able to render circles, rectangles, and text can allow us to implement scatterplots, line charts, and bar charts! When it comes to interactivity, there are also only a small number of crucial interactions: clicking, hovering (tooltips), scrolling (zooming), and dragging (panning, brushing, lassoing). Seems easy enough!
We just need to implement a plot rendering function, and return the bytes back to the calling language! If this is fast enough, then it will be feasible to execute such a rendering function on every frame (of a user interaction or animation), enabling us to use the same plotting function to generate both interactive and static plots. And with a little extra work, we can also implement SVG variants of each plotting function.
I set out to implement a proof of concept to determine whether this was feasible. I made my initial commit in August of 2025, marking the start of the Pluot project. A week later, I had gotten some (very basic) interactive Rust+WGPU rendering working in the browser via WASM bindings. With a few more days, I got proof-of-concept Python bindings working. However, it took until early 2026 to polish this proof of concept and get many other features working: text rendering, async data loading, cacheing, coordinate systems, aspect ratio handling, margins, vector rendering, and a layered plotting API.
As I went down this rabbit hole, I kept thinking to myself that I couldn't be the first person to think about this problem. I came across many open-source projects that seemed quite similar, but none that seemed to check all of the boxes of being fast, scalable, bitmap+vector, static+interactive, and interoperable (with bindings to multiple langauges, including web), and with a reasonable WASM bundle size (e.g., <10 MB). This final point turns out to be especially tricky, as it is easy to inadvertently add Rust crate dependencies that significantly increase the resulting WASM bundle size. Similarly, it is easy to add Rust crate dependencies that make WASM compilation difficult for one reason or another (e.g., depend on a C library that is tricky to compile to WASM) or use concurrency features (Rust's Send and Sync) in a way that prevents WASM compilation. Identifying this gap motivated me to continue to push the project along, especially once I had established the feasibility via the initial experiments.
While not yet production-ready, Pluot demonstrates the potential for a paradigm shift in how we create reproducible, performant, and cross-platform static and interactive visualizations.
Learn more
Here, I have focused on the personal motivations behind this project.
If you are interested in the technical details, check out the Pluot repository and website. There are still many open questions, some of which are listed in the GitHub issues.